|
Rpv Chart Helper application.
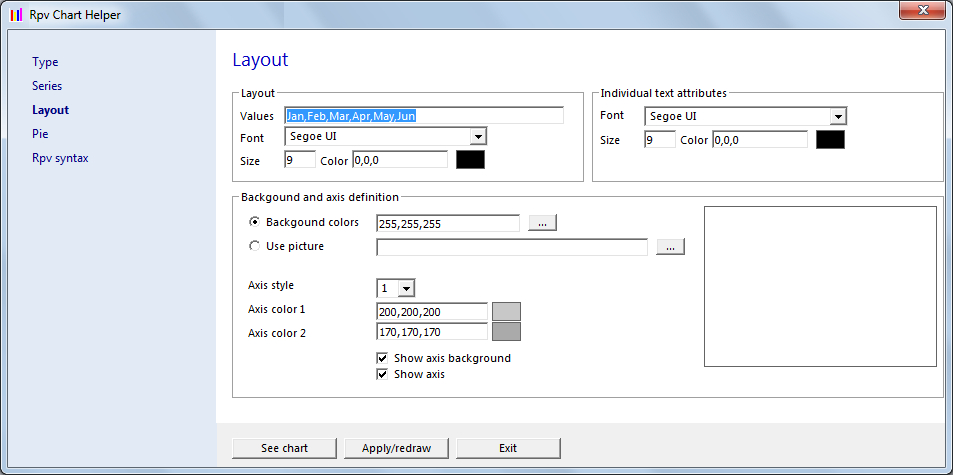
Layout, background and axis.
The second tab will let you define the
number of series that your chart will contain and to change its properties.

Layout.
In the layout section you will define the names and attributes of each value
that appears in the chart. It is possible to define font type, size and color.
Show values font attributes.
Used to determine the font attributes
(type, size and color) for the font to be used in the labels that indicate each
value.
Backgound and axis.
Here we will define more than one thing:
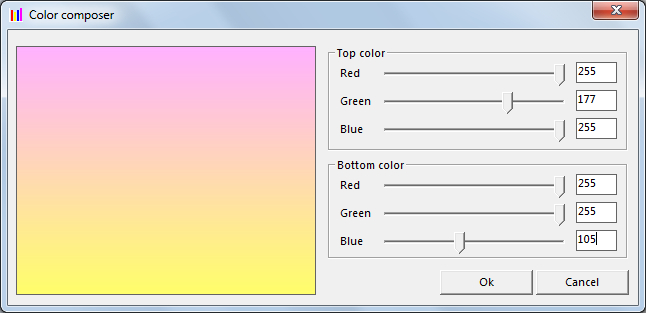
The background color is the combination of two colors. Since it is two colors,
it must be expressed using six values separated by commas. In case that the
second color is the same than first one, just indicate the three first values.
It is strongly recommended to use the backgound composer by clicking on the
"..." button.

Axis colors
Axis color #1 and axis color #2 are to define the two colors of the background
of the axis of the chart. This applies only for 2D and 3D charts, not available
for pie chart.
In case that you want only one color in
the axis background, just keep two values identical.
Show axis and show axis background.
Show axis determines if the axis (and the layout) will be shown for 2D and 3D
charts.
Show axis background will or not show the background of the axis (composed by
the two colors defined in axis colors).
|